- Home
- About Us
- Chapters
- Study Design and Organizational Structure
- Study Management
- Tenders, Bids, and Contracts
- Sample Design
- Questionnaire Design
- Instrument Technical Design
- Translation
- Adaptation
- Pretesting
- Interviewer Recruitment, Selection, and Training
- Data Collection
- Paradata and Other Auxiliary Data
- Data Harmonization
- Data Processing and Statistical Adjustment
- Data Dissemination
- Statistical Analysis
- Survey Quality
- Ethical Considerations
- Resources
- How to Cite
- Help

Study Design and Organizational Structure

Kristen Cibelli Hibben, Julie de Jong, Mengyao Hu, Jennifer Durow, and Heidi Guyer, 2016
(2010 Version: Rachel A. Orlowski and Christopher Antoun)
The following guidelines outline a number of study design and organizational considerations that arise when planning multinational, multicultural, or multiregional surveys, which we refer to as '3MC' surveys.
The goal of 3MC surveys is to produce comparable measures across multinational, multicultural, or multiregional populations. To maximize comparability, strict standardization of design is neither always possible nor desired. This is because of the considerable differences in survey context affecting survey design features across cultures and nations. For example, access to up-to-date or good quality sampling frames, the need to accommodate multiple languages (some possibly unwritten), and the available telecommunications, transportation, and research infrastructure, are among many other factors that may vary widely [zotpressInText item="{2265844:XRACUXSY},{2265844:9PUICZYY}" etal="Yes"].
3MC study designs that attempt to impose a cookie-cutter or 'one-size-fits-all' approach can actually harm comparability [zotpressInText item="{2265844:4S267T9N},{2265844:XBHDUFQG},{2265844:AU6ZLHGK},{2265844:UZMQ3EN4}" etal="Yes"]. For example, an optimal sampling design for one context is rarely optimal, or may be impossible or even detrimental to survey quality, if implemented in another context [zotpressInText item="{2265844:DKSC4DFC}"].
Therefore, the challenge in 3MC surveys is to determine the optimal balance between local implementation of a design within each country or culture that will also optimize comparison across countries or cultures [zotpressInText item="{2265844:BWMUUHCE}"]. The current approach taken by some cross-national surveys is to attempt some level of standardization across country surveys and to monitor and document compliance with the agreed upon standards (for example, see [zotpressInText item="{2265844:9VN2HJAS}" format="%a% (%d%)"]). Specifications provided to participating countries may require a probability sample, but acknowledge that available frames across countries will vary widely. Some frames will require a multi-stage sampling approach where others, such as those in countries with up-to-date registers, may be able to implement a one-stage sample design [zotpressInText item="{2265844:DKSC4DFC}"]. The European Social Survey, for example, acknowledges these different approaches to sampling in its specifications, and in addition to requiring a probability sample design, it also sets a minimum effective sample size, thereby taking into account the design effects (which contribute to sampling error) from the chosen design [zotpressInText item="{2265844:9VN2HJAS},{2265844:DKSC4DFC}" etal="yes"]. See [zotpressInText item="{2265844:BWMUUHCE}" format="%a% (%d%)" etal="yes"] for further discussion of challenges in optimizing comparison across countries.
Several factors influence how the overall 3MC study is designed, structured, and implemented, including the source(s) and flow of funding, the research capacity, and infrastructure in the participating countries (e.g., availability of sampling frames, field staff, and technical systems). All of these factors will vary from country to country, from culture to culture, and from study to study. Yet, before determining other aspects of the study design or the organizational structure, it is critical to clearly define the research questions and the aims and objectives of the study as this should drive subsequent decisions related to other stages in the survey lifecycle. And, it is equally crucial to consider how the ultimate decisions will impact survey quality, assessed in terms of total survey error (TSE), fitness for use, and survey process quality (see Survey Quality for a detailed discussion).
The TSE paradigm is widely accepted as a conceptual framework for evaluating survey data quality [zotpressInText item="{2265844:MT8VJDDI},{2265844:C5MQDRAC}"], but it can also be used as a blueprint when designing studies [zotpressInText item="{2265844:RCK4HJVV}"]. TSE defines quality as the estimation and reduction of the mean squared error (MSE) of statistics of interest, which is the sum of random errors (variance) and squared systematic errors (bias). The MSE for each individual statistic in a survey is not typically calculated, due to the following practical problems (see [zotpressInText item="{2265844:LV7WC8P2}" format="%a% (%d%)"] for detailed discussions). First, MSE needs to be calculated differently for different survey parameters (e.g., the survey population mean and variance). It can also differ for each survey item. The fact that a survey usually contains many items and many parameters poses a challenge for the practical application of MSE. Second, the true scores used in bias estimation are often unknown and are usually obtained from a benchmark survey, such as census data or 'gold standard' estimates such as from a face-to-face survey; the accuracy of these estimates is not guaranteed. Third, given that MSE is often a combination of different error sources, it is sometimes difficult to distinguish and separate these error sources. These practical issues become more complicated in 3MC surveys, posing additional challenges to the use of MSE. Despite the challenges, however, the TSE framework helps organize and identify error sources and estimates their relative magnitude, which can assist those planning 3MC surveys to evaluate design and implementation tradeoffs.
TSE takes into consideration both measurement (construct validity, measurement error, and processing error)—i.e., how well survey questions measure the constructs of interest—as well as representation (coverage error, sampling error, nonresponse error, and adjustment error) [zotpressInText item="{2265844:DDYLNLET}" etal="Yes"]—i.e., whether one can generalize to the target population using sample survey data. In the TSE perspective, there may be cost-error tradeoffs; that is, there may be tension between reducing these errors and the cost of reducing them.
Although the TSE paradigm is increasingly used as an organizing framework in the design and evaluation of one-country surveys, [zotpressInText item="{2265844:BWMUUHCE}" format="%a% (%d%)" etal="yes"] offer a total survey error framework adapted and expanded from [zotpressInText item="{2265844:DDYLNLET}" format="%a% (%d%)" etal="yes"], [zotpressInText item="{2265844:8X5QJLMK}" format="%a% (%d%)"], [zotpressInText item="{2265844:RCK4HJVV}" format="%a% (%d%)"], and [zotpressInText item="{2265844:725B7UKH}" format="%a% (%d%)"] for 3MC survey research that integrates error sources with methodological and operational challenges that are unique to or may be more prominent in 3MC surveys (see Figure 1 below).
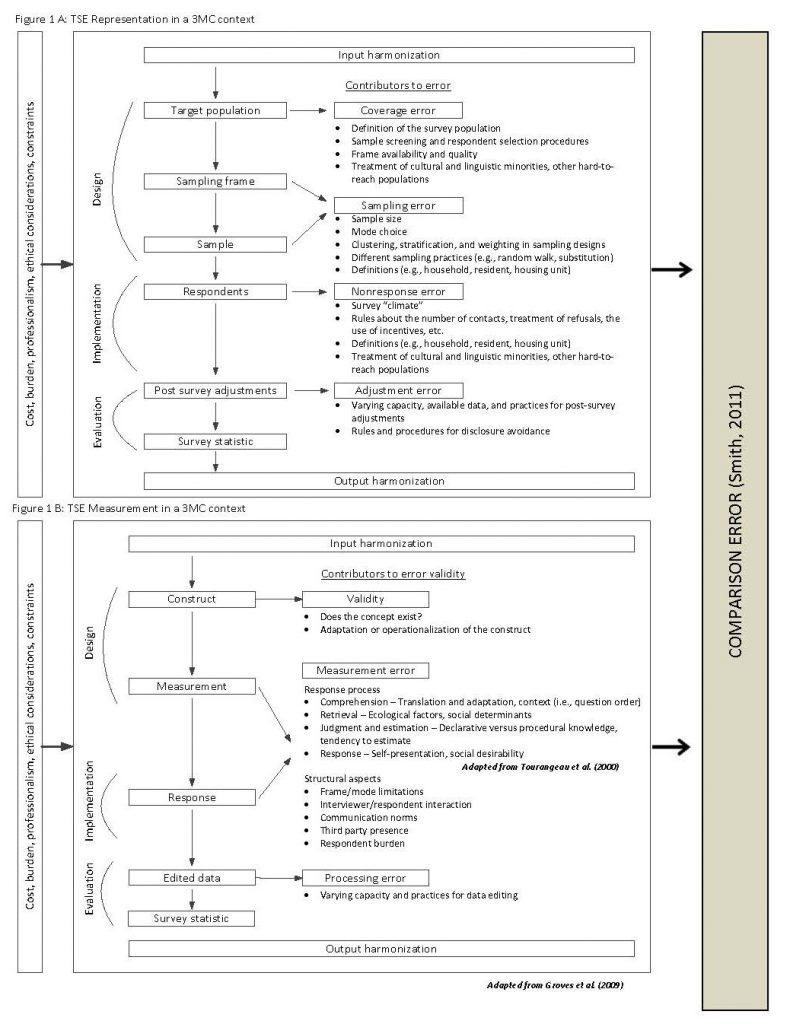
The following describes the main elements of [zotpressInText item="{2265844:BWMUUHCE}" format="%a% (%d%)" etal="yes"]'s TSE framework:
- The framework links error sources to the key stages of the survey process: design, implementation, and evaluation.
- Part A of Figure 1 outlines representation error—including coverage error, sampling error, nonresponse error, and adjustment error—which are indicators of how well survey estimates generalize to the target population.
- Part B of Figure 1 encompasses measurement-related error—including validity, measurement error, and processing error—which are indicators of how well survey questions measure the constructs of interest.
- As denoted by the resulting “survey statistic” at the end of parts A and B, the framework produces statistic-specific error profiles for representation and measurement errors for a single survey statistic. The framework produces statistic specific error profiles because the presence and scale of error may, and frequently does, vary across individual survey statistics.
- The framework incorporates the dimensions of cost, burden, professionalism, ethics, and other design constraints that frequently impose constraints on 3MC survey design and have an important influence on the quality of 3MC surveys.
- The framework includes the role of input harmonization and output harmonization, which are unique to 3MC surveys. Input and output harmonization represent two general approaches to harmonization, which is a term for procedures aimed at achieving, or at least improving, the comparability of different surveys. See Harmonization for further discussion.
- “Comparison error”—a concept introduced by [zotpressInText item="{2265844:PCAPN7RJ}" format="%a% (%d%)"]—is the conceptual error introduced across each component of a 3MC survey as well as the aggregate of error across all components, which could threaten comparability across surveys.
- For each error component (e.g., coverage error, sampling error, measurement error, etc.), key potential sources of error are identified that may contribute to TSE in individual populations and may present particular challenges to standardizing design and implementation (or establishing suitable localized equivalents) across populations, thereby potentially increasing comparison error. See [zotpressInText item="{2265844:BWMUUHCE}" format="%a% (%d%)" etal="yes"] for a detailed discussion of key potential contributions to error and design and implementation challenges across the main stages of the survey lifecycle.
As noted by [zotpressInText item="{2265844:RCK4HJVV}" format="%a% (%d%)"], TSE can be used during the design phase for 3MC studies in that each component of error can be considered with the object of minimizing comparison error.
The Cross-Cultural Survey Guidelines (CCSG) have been developed to cover all aspects of the lifecycle of 3MC surveys, as shown in the figure on the Chapters page. The lifecycle begins with the guidelines below on establishing aspects of the study design and organizational structure and ends with data dissemination (Data Dissemination). After reviewing the guidelines regarding study design and organizational structure below, we suggest reading Survey Quality followed by Study Management and then the guidelines for each of the elements of the survey lifecycle relevant to your study.
Goal: To consider the key study design decisions that must be addressed in the context of 3MC survey research and how these decisions impact each stage of the survey lifecycle as well as overall survey quality. Additionally, to establish the study’s overall structure, the mode of data collection, quality standards from a design perspective, and the elements of the survey lifecycle that are relevant for the study.
1. Determine key aspects of the overall research design of the study.
Rationale
The first step in designing a 3MC study is to determine key aspects of the overall research design of the study. This includes identification of the research questions and the aims and objectives of the study; assessing the available resources, budget, and research capacity of individual study countries, and available resources and budget for coordination between study countries; and determining the type of study (i.e., cross-sectional or panel), the duration of the study, the populations to be surveyed, and the estimated target number of interviews. Subsequent decisions, including those about organizational structure, the mode of data collection, quality standards, and other steps of the survey lifecycle are dependent upon the decisions reached in these key areas.
Procedural steps
1.1 Determine and document the research questions and aims and objectives of the study, ensuring that central and local study goals do not conflict [zotpressInText item="{2265844:M8ZJBZXV},{2265844:UGER5NIV}"]. All involved should understand the empirical aims of the research before the organizational and operational work for a study begins. There should be a well-defined direction and purpose of the research, and the aims and objectives should be clearly communicated to all study personnel at the central coordinating center and at study locales. When doing so, consider the following main components:
1.1.1 Study aims/goals: what are the primary research questions or hypotheses the study intends to address?
1.1.2 Representation: what populations are to be studied? See Sample Design and [zotpressInText item="{2265844:DDYLNLET}" format="%a% (%d%)"].
1.1.3 Measurement: what are the measures to be collected? What data are to be collected? See Questionnaire Design and [zotpressInText item="{2265844:DDYLNLET}" format="%a% (%d%)" etal="yes"].
1.1.4 Analysis: what estimates are to be created? (See Data Processing and Statistical Adjustment and Statistical Analysis.)
1.2 Investigate how other researchers have addressed similar research questions, and consider what data (if any) already exists and what additional data needs to be collected in order to address the research questions.
1.3 Consider whether survey data collection is optimal or whether other methods or mixed methods may be appropriate. Studies involving multiple cultures, countries, regions, or languages may benefit from the use of mixed methods. A mixed-methods study "involves the collection or analysis of both quantitative and/or qualitative data in a single study in which the data are collected concurrently or sequentially, are given a priority, and involve an integration of the data at one or more stages in the process of research" [zotpressInText item="{2265844:AMA6UWU6}"]. The different toolkits of qualitative and quantitative data collection methods can be complementary for studies of cross-cultural similarities and differences in attitudes and behaviors that often require different kinds of methods and evidence [zotpressInText item="{2265844:5ZWZAQD6}"]. Van de Vijver and Chasiotis also provide an in-depth discussion and a conceptual framework for mixed-methods studies. Researchers wanting to undertake a mixed-methods design or to incorporate mixed-methods approaches at different stages of the survey lifecycle may include these considerations when designing the study. Examples and references for mixed-methods approaches are provided in Pretesting, Questionnaire Design, and Data Collection: General Considerations.
1.4 Assess the available resources and budget for the project, which may affect the scope of the study’s aims and objectives that can be realistically undertaken, and will also guide subsequent decisions regarding all steps of the survey lifecycle. In particular, the available resources and budget for the overall coordination of study countries and the resources and research capacity available in individual countries is a key driver of the overall organizational structure for the study. The overall organizational structure of a 3MC survey can be either centralized or decentralized, with a central coordinating center as well as national coordinators in each of the individual study countries. As discussed in further detail in Guideline 2 below, a strong central coordinating center is crucial to effective quality assurance and quality control, but requires significant financial and human resources which may or may not be available depending on the available budget and infrastructure.
1.5 Determine whether to administer a cross-sectional survey or a type of panel survey.
1.5.1 Consider the following attributes of a cross-sectional survey (i.e., a survey where data are collected from selected elements at one point in time) with regard to the aims and objectives of the study.
-
- Since data are collected at only one point in time in a cross-sectional survey, countries can create an optimal sample design for that specific point in time. If the survey is repeated at a later date, the new cross-sectional study can accommodate changes in the target population which may have occurred, for example, because of migration or other demographic changes.
- Since sampling units are only asked to participate once in a cross-sectional survey, the respondent burden over time is less than it would be in a panel survey; this can make it easier to convince the sampling units to participate.
- In a cross-sectional survey, developments or changes on the individual level over time cannot be measured, and it is more difficult to advance a causal argument.
1.5.2 Consider the following attributes of a panel survey (i.e., a survey where the data are collected from selected elements at more than one point in time or in data collection waves [zotpressInText item="{2265844:48NS9TWJ},{2265844:H6ZQT8UX},{2265844:T6TE3V5N}"]) with regard to the aims and objectives of the study. Panel surveys include fixed panel, fixed panel plus births, repeated panel, rotating panel, and split panel studies.
-
- A panel survey provides the ability to measure changes over time on the statistics of interest at the respondent level.
- In a panel survey, the sampling design, while being optimal at the outset of the panel survey, may be dated and not optimal at a later point in time.
- Changes in the target population are difficult to accommodate (e.g., including new immigrants at a later stage) in a panel survey.
- The initial cost of a panel survey is higher than a cross-sectional survey since both thought and effort need to be expended to plan the best way to capture data over time.
- It can be difficult to convince respondents to participate across multiple waves of data collection, resulting in panel attrition and reduced sample size in successive waves. With each successive wave of data collection in a panel survey, the cumulative amount of respondent attrition typically increases. Unless the element sample from the original wave of data collection is supplemented with fresh cohorts, the remaining respondents may not accurately reflect the target population.
- For surveys of mobile populations, the attrition rate can be very high. Survey planners should consider how to identify and track panel survey respondents, especially when dealing with a mobile population.
- Question wording and response options need to be comparable across waves in order to allow comparison over time on the statistic of interest.
- Respondents’ answers to questions in later waves may be influenced by the interviews conducted in previous waves. This source of error is referred to “panel conditioning” or “time-in-sample bias” [zotpressInText item="{2265844:PQL7ZC7V}"].
- In contrast to a cross-sectional design, a comparative panel survey design implemented across many countries is much more complex. Designers should consider the efforts necessary to achieve comparability simultaneously across each national panel wave and across all countries.
1.6 Determine the timing and duration of the survey.
1.6.1 In some 3MC surveys, particularly those more susceptible to context effects (e.g., a survey of political attitudes), it may be important to complete the data collection in the same timeframe across all study countries.
1.6.2 Other surveys are constrained by a relatively short field period, which may have implications for data collection mode decisions and quality control.
1.6.3 The duration of the study is also dependent on the research goals and type of survey.
1.6.4 When planning the timing of the survey(s), other factors to consider include seasonal constraints (e.g. rainy seasons), available resources (e.g., longer field period may mean additional cost), and cultural factors (e.g., migration patterns and respondent availability).
1.6.5 The survey duration affects many phases of the survey lifecycle, but may have the biggest effect on interviewer recruitment and data collection. See Interviewer Recruitment, Selection, and Training and Data Collection: Face-to-Face Surveys.
1.7 Determine the target population.
1.7.1 In a 3MC survey, countries will likely differ in how target populations are defined. From country to country, inclusion criteria may be guided by restricted access to parts of a country’s population due to geography, language, instability in the political climate, and other factors. See [zotpressInText item="{2265844:DKSC4DFC}" format="%a% (%d%)"] and [zotpressInText item="{2265844:9PUICZYY}" format="%a% (%d%)"] for examples.
1.7.2 The definition of the target population will have implications for the sample design in each country. For example, if the target population is a specific subset (e.g., citizens with a diagnosed health condition), it may be more efficient to develop a sample frame in collaboration with health services, rather than launching an area-based probability sample and subsequently screening for this special population.
1.7.3 The target population will also impact mode decisions. In the example in Guideline 1.5.2 above, a sample frame developed in collaboration with health services may provide detailed contact information for each person on the sampling frame, which would permit multiple modes of targeting and data collection (e.g., an initial postal mailing informing the respondent of the data collection, a face-to-face contact, and/or ability for a follow-up telephone contact; or a telephone survey rather than a face-to-face survey). In the case of an area probability sample, names and telephone numbers are generally not known ahead of time, limiting mode choices.
1.7.4 The target population will also impact most of the other steps in the survey lifecycle, especially in a 3MC study. For example, a country whose target population is multi-lingual or multi-cultural will need to accommodate potential differences in survey items and measurement issues across populations. See especially Questionnaire Design, Translation: Overview, Interviewer Recruitment, Selection and Training, and Data Harmonization.
1.7.5 The definition of the target population in a 3MC study can affect multiple potential sources of both measurement and representation errors within the TSE framework and comparability. For example, it is important to consider the issue of language when defining the target population. Some countries may exclude language groups at the sampling stage, thereby introducing noncoverage error. Others may exclude these populations at the data collection stage, thereby introducing nonresponse error [zotpressInText item="{2265844:GUS65KHP}"]. Differences in how members of language groups are handled can result in sample designs with highly divergent coverage properties. [zotpressInText item="{2265844:DZK7E5JK}" format="%a% (%d%)"] encourages comparative survey researchers to carefully examine the language situation of the target population(s). In doing so, researchers are better equipped to choose the optimal interview language for multicultural and multilingual contexts, particularly in times of globalization. According to [zotpressInText item="{2265844:DZK7E5JK}" format="%a% (%d%)"], the choice of survey language needs to become an integral part of the study design from the beginning, rather than being an ad hoc decision.
Lessons learned
1.1 A failure to communicate overall study goals may lead to local decisions that threaten comparability across countries. For example, a country may remove some locally less salient items from the questionnaire in order to reduce the burden of time to both respondents and interviewers without realizing that those items are necessary to measure an important survey construct. Conversely, a country may insert items into the questionnaire in order to study a locally-relevant topic without realizing that those items may affect the quality of the data. When inserting new, or country-specific items, it is necessary to take into account respondent burden, context effects, and comparability if the addition of new items is replacing previously existing items.
1.2 The World Fertility Survey (WFS), its successor, the Demographic and Health Survey (DHS), and the International Social Survey Programme (ISSP) are well-known cross-cultural studies which have demonstrated that large-scale probability sample surveys are feasible almost everywhere. For all participating countries in these two studies, sampling frames and resources (including households) were found; local technicians executed complex tasks directed by a centralized international staff; and probability sampling and measurable sampling errors were imposed [zotpressInText item="{2265844:TY4XKPCD},{2265844:RLETTJBB}"].
1.3 Survey planners are not always aware of the time and effort required to design and implement quality cross-sectional sampling designs simultaneously across many countries. It might be instructive to consult the extensive documentation of the European Social Survey that includes design, control, and outcomes.
1.4 Survey planners are sometimes naïve about the high cost and effort required to maintain a panel survey. When considering the implementation of a panel survey, refer to the literature on longitudinal survey programs such as the Survey of Income and Program Participation [zotpressInText item="{2265844:E8BD9RB2}"], the British Household Panel Survey [zotpressInText item="{2265844:JEINBDTY}"], the European Community Household Panel [zotpressInText item="{2265844:AJJJ9W9S}"], Canada’s Survey of Labour and Income Dynamics [zotpressInText item="{2265844:GZSSW5NZ}"], and additional literature about the methods used in longitudinal surveys [zotpressInText item="{2265844:JEINBDTY}" etal="yes"] and panel surveys [zotpressInText item="{2265844:GS6CQNXB}"]. This literature gives a clear sense of the effort and expense necessary to execute a panel survey, and can help survey planners make a more judicious decision regarding the time dimension of the survey design.
1.5 The World Bank’s Living Standards Measurement Survey team has developed various household survey design, implementation, and analysis tools such as sample questionnaires and guidelines on questionnaire design, recommendations for maintaining cooperation and avoiding household attrition in longitudinal surveys, example survey manuals and documentation, and guidance for measuring specific topics such as conflict exposure, migration, and fisheries. See here for more information about the LSMS, here for LSMS guidebooks, and here for survey software tools available through the World Bank.
1.6 [zotpressInText item="{2265844:JYEFAQLR}" format="%a% (%d%)"] conclude that survey research organizations are still slow to adapt professional project management approaches which can improve quality, efficiency, and the overall success of 3MC surveys. The authors recommend that 3MC project leadership provides more detailed specifications, guidance, and support to research teams regarding project management concepts, processes, and tools (such as templates for reports and documentation). [zotpressInText item="{2265844:JYEFAQLR}" format="%a% (%d%)" etal="yes"] also encourage efforts for 3MC surveys to share lessons learned on what project management approaches worked and did not work.
1.7 Following a review of strategies from several longitudinal surveys, [zotpressInText item="{2265844:AUGKHHDH}" format="%a% (%d%)"] identify the following best practices regarding panel maintenance and retention: collecting comprehensive contact information at each wave; maintaining contact with sample members between waves; tracking sample members between waves; distributing calls over different times of the day and week; re-contacting refusers; considering incentives; and employing well-trained, experienced, and motivated interviewers. However, the authors also stress that not all strategies are feasible in all survey countries due to institutional, legal, or cultural constraints.
1.8 Using major Swiss general population survey data, [zotpressInText item="{2265844:VFW7MB4P}" format="%a% (%d%)"] found that response representation bias decreased by 10% when additional interview languages like English or Serbo-Croatia were offered. However, the authors conclude that the decision to offer additional interview languages ultimately depends on the language proficiency structure of the target population and survey concepts which could be biased by the respondent’s degree of language proficiency [zotpressInText item="{2265844:VFW7MB4P}"].
1.9 [zotpressInText item="{2265844:9IASTL4Z}" format="%a% (%d%)"] found some evidence that bilingual respondents provide different responses to questions connected to culture-related norms and expectations (e.g. mental and physical health or alcohol use) depending on the interview language. In particular, language effects were found for responses to the family pride scale in one survey and in reporting of alcohol consumption in another. Effects for other measures of physical and mental health were in the hypothesized direction but were not statistically significant, possibly due to relatively small sample size or differences in the parameterization of the concept. However, support was also found for the hypothesis that language will not affect all types of survey questions equally, as responses to demographic questions (e.g., marital status, number of household members) did not show an effect of interview language. Peytcheva concludes that the results of her investigation suggest that the interview language for bilingual respondents may pose a threat to data quality in surveys of immigrants and ethnic minorities, and that replication of her findings is urgently needed. In the meantime, [zotpressInText item="{2265844:9IASTL4Z}" format="%a% (%d%)"] stresses that assignment of interview languages should be informed by the goals of the survey, as leaving the choice of interview language up to a bilingual, bicultural respondent may affect data quality.
2. Determine the study’s organizational structure.
Rationale
As a rule, the more languages, cultures, and countries there are participating in the survey, the more complex the organizational structure becomes. There are many different ways to organize the structure (see Appendix A for examples), but the key considerations are the locus of control and balancing standardization and localization. The locus of control may be centralized (e.g., all design and operational decisions controlled by a central governing body) or decentralized (e.g., each country makes their own operational decisions while adhering to the study design protocols set by the centralized team). While both centralized and decentralized 3MC surveys are fielded, it is indisputable that a strong centralized infrastructure is needed to maintain quality requirements [zotpressInText item="{2265844:8L5B46G9},{2265844:2QXU9JUZ},{2265844:4WJ8W22P},{2265844:BWMUUHCE},{2265844:8G9ME7H3}"]. For this reason, we outline the advantages of a centralized organization, and only briefly discuss a decentralized organizational structure. As the optimal organizational structure for 3MC surveys, a centralized structure is assumed throughout the guidelines.
Procedural steps
2.1 Consider maintaining the locus of control as centralized rather than decentralized.
2.1.1 When the control is centralized, there is a structure with a coordinating center that designs the overall study and assumes the central organizational responsibility to the contracted survey organizations in each country where the study will be carried out. This type of organizing structure is often used in 3MC surveys.
2.1.2 A coordinating center should include people from different countries, institutions, and affiliations.
2.1.3 With this organizational structure, the coordinating center will specify the operational structure of the survey for each country to follow. It should determine what elements will be standardized across countries and what elements will be localized; there is a balance between standardization of implementation and adaptation to the cultural context. The coordinating center should inform the survey organizations of the quality standards necessary to execute the study. See Guideline 4 below and Survey Quality.
2.1.4 Although not described here, there are situations where the coordinating center is also responsible for data collection in some or all countries.
2.1.5 When the control is decentralized, each country makes their own operational decisions while adhering to the study design protocols set by the centralized team.
2.1.6 In a decentralized organizational structure, even though all study countries may agree in principle to study design decisions and to protocols for quality assurance and quality control, there is no guarantee that these protocols will be followed. Only strict oversight from a centralized organizational structure can hope to achieve adherence to protocols.
Lessons learned
2.1 Despite knowing the ideal way of executing a study, the available resources often dictate how a study is structured and implemented. For example, multiple sources of funding are typically needed to provide enough support to coordinate a 3MC survey; furthermore, each participating country may be funded separately. Funding sources may have requirements that complicate reporting structures within the study and conflict with the goals of the overall cross-cultural survey. The points at issue may relate to a wide variety of features, from data availability to the content of questionnaires. See Appendix B for examples of how existing 3MC survey programs have been funded.
2.2 As [zotpressInText item="{2265844:BWMUUHCE}" format="%a% (%d%)"] note, organizational structure for a 3MC study can be thought of as two extremes. At one end, for a study that is decentralized, a source questionnaire is provided and the details are left up to the participating countries and service providers who deliver the requested data. The other extreme can be represented by the ESS that has developed a solid and continuously improving machinery for planning and implementing the survey. One of Sir Roger Jowell’s, founder of the ESS, golden rules for comparative surveys was that the number of problems is a function of the number of countries participating in a study [zotpressInText item="{2265844:CUBTBHA2}"]; see also [zotpressInText item="{2265844:8G9ME7H3}" format="%a% (%d%)"]). It goes without saying that keeping track of 20 countries is easier than keeping track of 140. In the latter case, the idea that one is in control is very unrealistic without extensive funding for a central infrastructure. We believe that a solid infrastructure is imperative for 3MC surveys to function well and that it is better to limit the number of countries than try to include as many as possible” [zotpressInText item="{2265844:BWMUUHCE}" etal="yes"].
3. Determine the mode of data collection to be used and whether it will be standardized across countries and if mixed-mode data collection will be permitted within countries.
Rationale
Whether dictated by the coordinating center or left to individual survey organizations to determine, selecting the mode(s) in which the survey will be administered is a major design decision. Surveys can be conducted in numerous ways: face-to-face, by telephone (either conducted by an interviewer or using Interactive Voice Response (IVR)), through the mail, or over the web. The survey instrument format can be paper-and-pencil or computer-assisted and either interviewer-administered or self-administered. See [zotpressInText item="{2265844:36QWWL7A}" format="%a% (%d%)"] for a review of surveys modes and their advantages and disadvantages and error structures.
The mode of data collection affects most stages of the survey lifecycle, but arguably the greatest affect is on instrument technical design, data collection, and data processing. Equally affected by mode are issues of comparability, survey cost, and survey error. There is no one 'best' mode; rather, the mode(s) of data collection should be selected based on appropriate tradeoffs of time, cost, and error. In a 3MC survey, differences in cultural norms, literacy levels, and logistics may further constrain mode selection.
This guideline focuses on the attributes of different modes vis-à-vis other steps in the survey lifecycle as well the use of a mixed-mode design, while also referring the reader to specific chapters for further detail.
Procedural steps
3.1 Sample design and the mode of data collection are intertwined and the decision about one will affect the decision about the other. When choosing the mode of data collection, consider the following:
3.1.1 The target population for any individual country can influence the decision to collect data via face-to-face, telephone, or self-administered interviews. The following are several examples of the implications of the target population on mode choice.
-
- If the target population is a nationally representative sample and the geographic region of the country is large (e.g., the United States, Russia, China, etc.), then a face-to-face survey will be significantly more costly than a telephone or self-administered survey.
- If the target population is a population in a climate which is politically unstable, interviewers attempting to complete a survey via telephone may be seen as suspect; and only an interviewer in a face-to-face setting may be able to obtain cooperation with a respondent.
3.1.2 The availability of the sampling frame and associated infrastructure of the study country can influence the decision to administer a face-to-face, telephone, or self-administered survey.
-
- For example, many surveys use a sample frame based on an area probability sample and subsequent block listing. Depending on the country’s infrastructure, it may or may not be possible to match the household with a telephone number (although this has limitations as well). In such cases where the infrastructure does not permit telephone/address matching, a face-to-face contact or mail survey would be the only way to initially reach the household.
3.2 Consider the length and complexity of the questionnaire when assessing the suitability of different modes.
3.2.1 If the survey is lengthy, a face-to-face interview may be less burdensome to the respondent than a telephone interview [zotpressInText item="{2265844:XIXCLD3J}"].
3.2.2 If the survey has many skip patterns, then an interviewer-administered survey, either by telephone or face-to-face, is preferable to mail survey. A web-based survey may also be suitable if the instrument is programmed so that the respondent does not need to navigate skip patterns.
3.2.3 If the survey is complex and may be difficult for the respondent to understand, then an interviewer-administered survey, either by telephone or face-to-face, is advisable so that the interviewer can assist the respondent if necessary.
3.2.4 See Instrument Technical Design and Data Collection: Face-to-Face Surveys for further discussion on questionnaire design vis-à-vis data collection mode.
3.3 Consider the survey topic and potential sensitivity of survey items.
3.3.1 If the survey topic is sensitive in an individual study country, a face-to-face interview may serve to put the respondent at ease. Alternately, a survey including sensitive questions may best be, at least partially, self-administered. What is considered as sensitive in one country may not be considered as sensitive in another. See Data Collection: Face-to-Face Surveys and Data Collection: Self-Administered Surveys for a comprehensive discussion of sensitive topics vis-á-vis data collection mode.
3.4 Consider what types of paradata or other auxiliary data might be collected.
3.4.1 Paradata is collected for quality assessment and quality control. An electronic instrument can capture a variety of paradata, whereas a paper-and-pencil instrument cannot capture most paradata.
3.4.2 Biomeasures and other auxiliary data can be used for quality assessment and quality control, as well as a complementary data source. Specific auxiliary data may require use of a specific mode of data collection.
-
- For example, if biomeasures are to be used, face-to-face surveys can facilitate the collection, and indeed may be necessary depending on the type of biomeasures (e.g., blood draw, blood pressure, etc.). However, some biomeasures, such as saliva, can be collected through respondents returning samples through postal mail.
3.4.3 See Paradata and Other Auxiliary Data and Survey Quality for further discussion.
3.5 Consider whether mode will be standardized for a 3MC survey project, or if a mixed-mode design will be permitted.
3.5.1 Different modes may produce different survey estimates. These mode-specific differences in measurement might be acceptable to the investigator if nonresponse is sufficiently reduced.
3.5.2 Some studies in the United States employ a mixed-mode design in which the least expensive mode is used initially, after which time progressively more expensive modes are implemented in order to reduce nonresponse.
3.5.3 See Data Collection: General Considerations for additional discussion of mixed-mode designs and Data Collection: Face-to-Face Surveys for a review of mode effects for sensitive topics.
Lessons learned
3.1 While a mixed-mode design can reduce the cost of data collection by allowing for increased flexibility to accommodate local contexts, it may also create an additional layer of complexity and, thus, of the overall costs for the subsequent harmonization of data by coordinating centers. The Gallup World Poll implements a mixed-mode design in which the telephone is used in countries where 80% or more of the target population is covered, and face-to-face interviewing is used in countries with lower telephone coverage. The reported costs of telephone surveys are much lower than face-to-face modes [zotpressInText item="{2265844:M8ZJBZXV}"], so overall data collection costs are reduced. However, comparability problems due to different modes (phone in one country, face-to-face in another) may exist [zotpressInText item="{2265844:HHWZAXWB}"], and this mixed-mode approach could lead to noncoverage of up to 20% of a country’s population.
3.2 In a cross-national context, the impact of mode can be confounded with cultural differences. For example, when the International Social Survey Programme (ISSP) began, the required mode was a self-administration. However, low literacy levels in some countries necessitated the use of interviewers. Both response rates and reports from substantive measures differed widely, possibly as a result of differences in mode [zotpressInText item="{2265844:XBHDUFQG}"]. Therefore, reported variation between countries on survey estimates may indicate substantive differences or may be a result of mode effects and interviewer effects.
3.3 The European Social Survey (ESS) prefers that all data collection be conducted via face-to-face interviews. However, due to local survey infrastructures and costs, some countries want to consider paper-and pencil mode, computer-assisted interviewing, or a combination of modes. Extensive research carried out by the ESS to date indicates that the disadvantages would strongly outweigh the advantages of a mixed-mode approach in the ESS [zotpressInText item="{2265844:VANNA8LV}"]. For now, therefore, the ESS has concluded that any move to a mixed-mode data collection would be a threat to comparability.
3.4 The Survey of Health, Ageing and Retirement in Europe (SHARE) has collected biomeasures such as grip strength and walking speed from wave 1 and onward. Based on their experiences with SHARE, [zotpressInText item="{2265844:TTDU5MHB}" format="%a% (%d%)"] list the following principal challenges to consider: country-specific regulations regarding types of biomeasures, ethics approval, and who is allowed to collect them; logistics of shipping, customs regulation, and storing of biological data; interviewer training and assessment; and last but not least, efficient and continuous monitoring and quality control procedures both regarding data collection and shipment.
4. Decide upon quality standards necessary for the implementation of the study from a design perspective.
Rationale
The goal of quality standards is to achieve excellence for all components related to the data [zotpressInText item="{2265844:IRZVGYKZ},{2265844:SJAQF7QX}"]. Setting quality standards is critical to ensuring the same level of methodological rigor across countries [zotpressInText item="{2265844:UGER5NIV}"]. Local adaptations will be necessary and appropriate for some aspects of implementation of the study, but any adaptation in the procedure or instrument should be thoroughly discussed, evaluated, and documented beforehand [zotpressInText item="{2265844:SN427237}"]. Frequent measurement and reporting to the coordinating center, along with sufficient methodological support, should allow for timely intervention if problems arise.
Survey quality is a vague concept, which has multiple definitions and has origins in two different developmental paths [zotpressInText item="{2265844:M8ZJBZXV},{2265844:9UF9QU9P}"]. One path is the total survey error paradigm; the other path focuses more on quality management sciences, including fitness for use and survey process quality [zotpressInText item="{2265844:9UF9QU9P}"]. The development of the overall paradigm of survey quality from both the total survey error (TSE) perspective, as well as the quality management sciences perspective, as mentioned by [zotpressInText item="{2265844:9UF9QU9P}" format="%a% (%d%, %p%)"], has taken place mainly in official statistics and organizations and has been triggered by the rapid development of technology and other developments. See Survey Quality for a comprehensive discussion of these different survey quality frameworks.
Procedural steps
4.1 Use a Plan-Do-Check-Act cycle (PDCA) by first determining the study’s quality standards, then implementing them throughout the research process while assessing quality indicators at each stage, and finally making appropriate changes to repeat the PDCA cycle [zotpressInText item="{2265844:M8ZJBZXV},{2265844:RIXJWFQ4}"].
4.1.1 Consider all potential sources of error in the survey lifecycle, and define quality indicators for key steps in each survey task. See Survey Quality for common sources of error and possible indicators, as well as a thorough discussion of how the TSE, fitness for use, and survey process quality frameworks can guide assessment of error through the steps of the survey lifecycle.
4.2 Acquaint study organizers with important quality control literature that distinguishes between common and special causes of variation, as well as explains how to act on information about these different kinds of variation [zotpressInText item="{2265844:7JSSADDV},{2265844:EG7IVBN6},{2265844:9C2QTB39}"].
4.3 Form a team in each country that regularly meets to discuss the quality of the local survey. The team should have or be provided with the needed methodological expertise. The team should document and report any concerns to the coordinating center [zotpressInText item="{2265844:KW4B3BHI},{2265844:M8ZJBZXV}"].
4.4 Identify tools that control and maintain operational process quality.
4.5 Implement a certification process or a signing-off procedure for each stage in order to check and document that the study design and specification standards are being followed.
4.5.1 Quickly address and remedy, if possible, any deviations from expectations that may occur [zotpressInText item="{2265844:M8ZJBZXV}"].
4.5.2 Invoke sanctions, as specified in the contract, if the certification is not fulfilled.
4.6 Consider site visits to all countries to monitor or support the implementation of quality standards. Make sure these visits are specified in the contract with each survey organization.
4.7 If and where possible, incorporate methodological research. This will inform long-term quality improvement [zotpressInText item="{2265844:CUBTBHA2},{2265844:SJAQF7QX}"]. See also Paradata and Other Auxiliary Data for further discussion on the use of these data for methodological analyses.
Lessons learned
4.1 Variations in country-level research infrastructure, research traditions, and methodological rigor need to be thoroughly investigated and understood when setting quality standards. Some countries will need more assistance in meeting certain standards, and this should be taken into account early in the planning process.
[zotpressInTextBib style="apa" sortby="author"]