- Home
- About Us
- Chapters
- Study Design and Organizational Structure
- Study Management
- Tenders, Bids, and Contracts
- Sample Design
- Questionnaire Design
- Instrument Technical Design
- Translation
- Adaptation
- Pretesting
- Interviewer Recruitment, Selection, and Training
- Data Collection
- Paradata and Other Auxiliary Data
- Data Harmonization
- Data Processing and Statistical Adjustment
- Data Dissemination
- Statistical Analysis
- Survey Quality
- Ethical Considerations
- Resources
- How to Cite
- Help

Appendix D
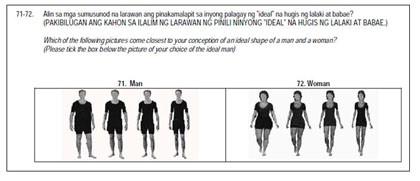
Figures D1 through D3, taken from Dutch questionnaires of the International Social Survey Programme (ISSP), shows how different visual scales might result in distinctive response distributions. In 1987, the Dutch questionnaire used the scale that displayed a truncated pyramid, while other countries used a scale with 10 vertically stacked squares. As a result, the response distribution from the Dutch question differed from that of other countries and did not correlate well with other Dutch measures [zotpressInText item="{2265844:HXBDJ5S2}"]. The Dutch scale for the social ladder question was later changed to more closely resemble the visual display used by other countries (Figure D3). Figures D4 and D5 show differences in graphics used for a body shape question in the ISSP 2007 Austrian and Philippines questionnaires.
Figure D1: Social ladder in ISSP 1987 Dutch questionnaire.
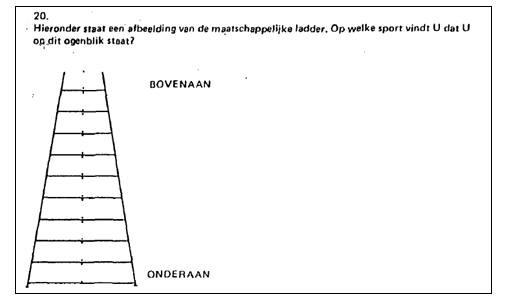
Figure D2: Social ladder in ISSP 1987 Great Britain questionnaire.
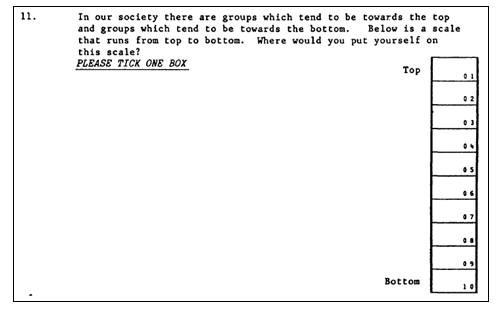
Figure D3: Social ladder in ISSP 2004 Dutch questionnaire.
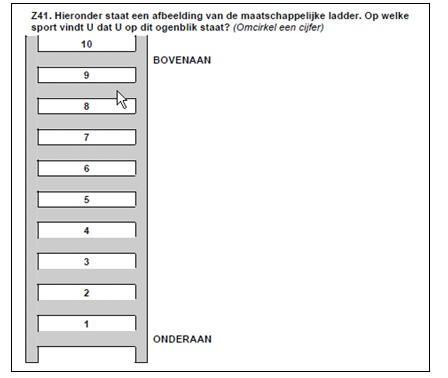
Figure D4: Ideal shape question in ISSP 2007 Austrian survey.
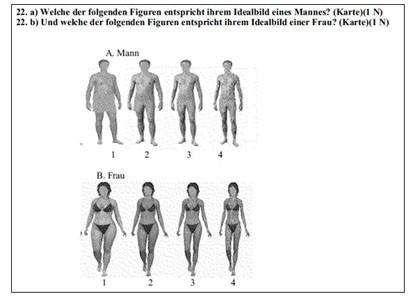
Figure D5: Ideal shape question in ISSP 2007 Philippines survey.