- Home
- About Us
- Chapters
- Study Design and Organizational Structure
- Study Management
- Tenders, Bids, and Contracts
- Sample Design
- Questionnaire Design
- Instrument Technical Design
- Translation
- Adaptation
- Pretesting
- Interviewer Recruitment, Selection, and Training
- Data Collection
- Paradata and Other Auxiliary Data
- Data Harmonization
- Data Processing and Statistical Adjustment
- Data Dissemination
- Statistical Analysis
- Survey Quality
- Ethical Considerations
- Resources
- How to Cite
- Help

Survey Quality
Sue Ellen Hansen, Grant Benson, Ashley Bowers, Beth-Ellen Pennell, Yu-chieh (Jay) Lin, Benjamin Duffey, Mengyao Hu, and Kristen Cibelli Hibben, 2016
Introduction This chapter presents a framework for assessing quality in multinational, multicultural, or multiregional surveys, which we refer to as '3MC' surveys, followed by guidelines for managing and assessing quality throughout the survey lifecycle. To monitor and control the performance of survey operations, survey organizations have developed methods and procedures to prevent and correct problems that can affect survey data quality [zotpressInText item="{2265844:7JSSADDV}"]. Such methods and procedures are often referred to as 'quality assurance' (Guideline 3), which refers to the planned procedures and activities an organization uses to ensure that the study meets quality requirements. A concept closely related to quality assurance is survey process quality management, otherwise referred to as 'quality control' (see Figure 4), which refers to a planned system of process monitoring, verification and analysis of indicators of quality, and updates to quality assurance procedures to ensure that quality assurance works. In some respects, quality control (Guideline 4) may be viewed as part of quality assurance [zotpressInText item="{2265844:7JSSADDV}"]. However, they are separated in this set of guidelines to make monitoring and controlling performance and product quality an explicit part of quality management (Guideline 2). In monocultural surveys, assessing the quality of survey data requires adequate documentation of the entire survey lifecycle and an understanding of protocols used to assure quality. In such surveys, there may be challenges in overcoming methodological, organizational, and operational barriers when performing quality assurance and quality control. For example, a country may not have the infrastructure, or an organization may not have the means to implement a study entirely according to survey best practices. In 3MC survey projects, the challenges increase. As noted by [zotpressInText item="{2265844:DUHNMIAC}" format="%a% (%d%)"], “quality assurance and quality control programs are, in general, less prominent and visible in cross-national comparative studies than in national surveys”. 3MC surveys hinge on the comparability or equivalence of data across cultures. Moreover, 3MC survey quality assessment procedures and criteria become more complex with additional survey processes, such as adaptation and translation of questions and harmonization of data across multiple surveys (see Adaptation, Translation, and Data Harmonization), leaving little room for quality assurance and quality control. This is especially true in countries with limited “financial, methodological, and technological resources and expertise” [zotpressInText item="{2265844:AELZ9PM9}"]. Given the magnified quality assurance and quality control problems in 3MC surveys, as suggested by [zotpressInText item="{2265844:DUHNMIAC}" format="%a% (%d%)" etal="yes"], it is of critical importance to make sure to include these quality programs, insofar as possible, in 3MC surveys. As the survey lifecycle illustrates, quality and ethical considerations are relevant to all processes throughout survey production. Survey quality can be assessed in terms of fitness for intended use (also known as "fitness for purpose" [zotpressInText item="{2265844:83L45ASH}"]), total survey error, and the monitoring of survey production process quality, which may be affected by survey infrastructure, costs, respondent and interviewer burden, and study design specifications. Quality Framework Survey quality is a vague concept, which has multiple definitions and origins in two different developmental paths [zotpressInText item="{2265844:M8ZJBZXV},{2265844:9UF9QU9P}"]. One path is the total survey error paradigm; the other path focuses more on quality management sciences, including fitness for use and survey process quality (see below) [zotpressInText item="{2265844:9UF9QU9P}"]. The development of the overall paradigm of survey quality from both the total survey error perspective as well as the quality management sciences perspective, as mentioned by [zotpressInText item="{2265844:9UF9QU9P}" format="%a% (%d%)"], has taken place mainly in official statistics and organizations and has been triggered by the rapid development of technology and other developments. Technological developments have largely improved the efficiency of quality monitoring and control procedures, and has influenced potential quality dimensions like “accessibility, timeliness, and coherence” [zotpressInText item="{2265844:9UF9QU9P}"]. In addition, given the increased demands for harmonized and comparable survey statistics and complex decision-making, it is essential to develop a quality framework that can accommodate all of these demands [zotpressInText item="{2265844:9UF9QU9P}"]. Various quality frameworks have been developed for this reason. See [zotpressInText item="{2265844:9UF9QU9P}" format="%a% (%d%)"] for more information on the development of the survey quality paradigm and different frameworks. The framework adopted in this chapter for assuring and assessing quality is informed by research on survey errors and costs and quality management, and highlights three aspects of quality: total survey error [zotpressInText item="{2265844:YHPXI3LA},{2265844:DDYLNLET}"], fitness for intended use [zotpressInText item="{2265844:IRZVGYKZ}"] (also known as “fitness for purpose” [zotpressInText item="{2265844:83L45ASH}"]), and survey process quality [zotpressInText item="{2265844:M8ZJBZXV},{2265844:HQ543TSB},{2265844:8XNZHEFA}"]. The three aspects of quality are described in turn below: Total survey error The total survey error (TSE) paradigm is widely accepted as a conceptual framework for evaluating survey data quality [zotpressInText item="{2265844:MT8VJDDI},{2265844:C5MQDRAC}"]. Errors in survey estimates consist of variances of estimates (reflecting estimate instability over conceptual replications) and systematic deviations from a target value ('biases'). TSE defines quality as the estimation and reduction of the mean squared error (MSE) of statistics of interest, which is the sum of random errors (variance) and squared systematic errors (bias). The MSE for each individual statistic in a survey is not typically calculated, due to the following practical problems (see [zotpressInText item="{2265844:LV7WC8P2}" format="%a% (%d%)"] for detailed discussions). Firstly, MSE needs to be calculated differently for different survey parameters (e.g., the survey population mean and variance). It can also differ for each survey item. The fact that a survey usually contains many items and parameters poses a challenge for the practical application of MSE. Secondly, the true scores used in bias estimation are often unknown and are usually obtained from a benchmark survey, such as census data, or 'gold standard' estimates, such as from a face-to-face survey, and the accuracy of these estimates is not guaranteed. Thirdly, given that MSE is often a combination of different error sources, it is sometimes difficult to distinguish and separate these error sources. These practical issues become more complicated in 3MC surveys, posing additional challenges to the use of MSE. Despite the challenges, however, the TSE framework helps organize and identify error sources and estimates their relative magnitude, which can assist those planning 3MC surveys to evaluate design and implementation tradeoffs. TSE takes into consideration both measurement (construct validity, measurement error, and processing error)—i.e., how well survey questions measure the constructs of interest—as well as representation (coverage error, sampling error, nonresponse error, and adjustment error) [zotpressInText item="{2265844:DDYLNLET}"]—i.e., whether one can generalize to the target population using sample survey data. In the TSE perspective, there may be cost/error tradeoffs; that is, there may be tension between reducing these errors and the cost of doing so. Although the TSE paradigm is increasingly used as an organizing framework in the design and evaluation of single-country surveys [zotpressInText item="{2265844:IC9CKU2Y}"], it is rarely cited in reference to 3MC research. [zotpressInText item="{2265844:BWMUUHCE}" format="%a% (%d%)"] offer a total survey error framework adapted and expanded from [zotpressInText item="{2265844:DDYLNLET}" format="%a% (%d%)" etal="yes"], [zotpressInText item="{2265844:8X5QJLMK}" format="%a% (%d%)"], [zotpressInText item="{2265844:RCK4HJVV}" format="%a% (%d%)"], and [zotpressInText item="{2265844:725B7UKH}" format="%a% (%d%)"] for 3MC survey research that integrates error sources with methodological and operational challenges that are unique to or may be more prominent in 3MC surveys (see Figure 1 below). It is important to note that like the framework proposed by [zotpressInText item="{2265844:DDYLNLET}" format="%a% (%d%)" etal="yes"], [zotpressInText item="{2265844:BWMUUHCE}" format="%a% (%d%)" etal="yes"]'s framework does not elaborate on the distinction between systematic and variable error discussed above for the sake of parsimony.
Figure 1.
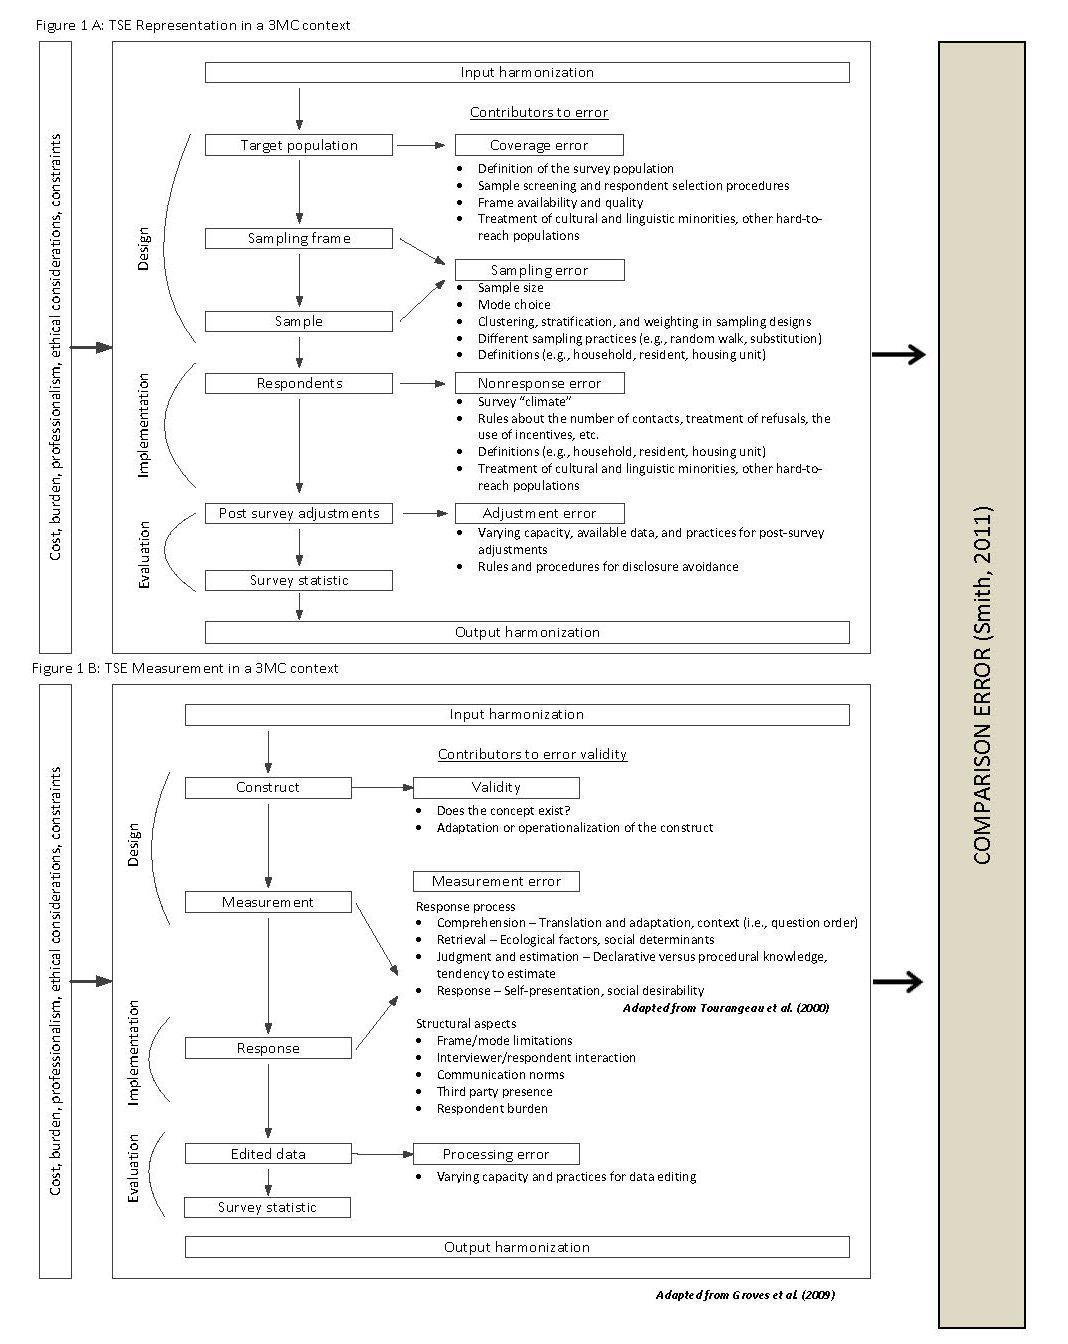 The following describes the main elements of [zotpressInText item="{2265844:BWMUUHCE}" format="%a% (%d%)" etal="yes"]'s TSE framework:
- The framework links error sources to the key stages of the survey process: design, implementation, and evaluation.
- Part A of Figure 1 outlines representation error—including coverage error, sampling error, nonresponse error, and adjustment error—which are indicators of how well survey estimates generalize to the target population.
- Part B of Figure 1 encompasses measurement-related error—including validity, measurement error, and processing error—which are indicators of how well survey questions measure the constructs of interest.
- As denoted by the resulting “survey statistic” at the end of parts A and B, the framework produces statistic-specific error profiles for representation and measurement errors for a single survey statistic. The framework produces statistic-specific error profiles because the presence and scale of error may, and frequently does, vary across individual survey statistics.
- The framework incorporates the dimensions of cost, burden, professionalism, ethics, and other design constraints that frequently impose constraints on 3MC survey design and have an important influence on the quality of 3MC surveys.
- “Comparison error”—a concept introduced by [zotpressInText item="{2265844:PCAPN7RJ}" format="%a% (%d%)"]—is the conceptual error introduced across each component of a 3MC survey as well as the aggregate of error across all components, which could threaten comparability across surveys.
- For each error component (e.g., coverage error, sampling error, measurement error, etc.), key potential sources of error are identified that may contribute to TSE in individual populations and may present particular challenges to standardizing design and implementation (or establishing suitable localized equivalents) across populations, thereby potentially increasing comparison error. See [zotpressInText item="{2265844:BWMUUHCE}" format="%a% (%d%)" etal="yes"] for a detailed discussion of key potential contributions to error and design and implementation challenges across the main stages of the survey lifecycle.
Table 1: Dimensions of quality.
| Quality Dimension | Description |
| Comparability | Are the data from different countries or cultures comparable to each other (i.e., equivalent)? |
| Coherence | Do the data form a coherent body of information that can be rearranged or combined with other data? |
| Relevance | Do the data meet the requirements of the client and users? |
| Accuracy | Are the data describing the phenomena that they were designed to measure; that is, are the survey estimates close to the true values of the population parameters they are meant to measure? |
| Timeliness and punctuality | How much time has elapsed between the end of the data collection and when the data are available for analysis? Are the data available when expected, based on client specifications? |
| Accessibility | Can users easily obtain and analyze the data? |
| Interpretability | Do the data make sense in terms of users’ hypotheses? Are supplementary data available to facilitate analysis: e.g., data that describe the major characteristics and structure of the data (metadata) as well as data about the survey processes (paradata and other auxiliary data)? |
- Cost: are monetary resources optimized?
- Burden: given the necessary information obtained, are interviewer and respondent burden minimized?
- Professionalism: are staff provided with clear behavioral guidelines and professional training, are there adequate provisions to ensure compliance with relevant laws, and is there demonstration that analyses and reporting have been impartial? Note that the professionalism can vary significantly across countries, and tailored specifications and trainings may be needed.
- Design Constraints: are there context-specific constraints on survey design that may have had an impact on quality (for example, use of a different mode of data collection in one culture than in others, or use of different sample frames between countries)?
Figure 2: Fitness for intended use ('Quality' dimensions) and total survey error ('Accuracy' dimension).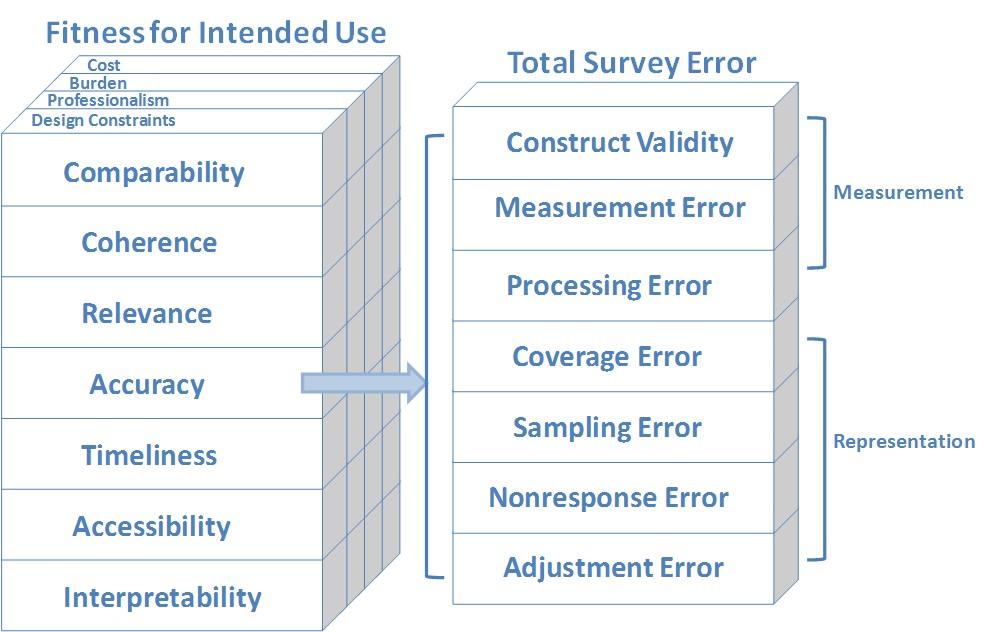
- The quality dimensions of coherence and comparability are the raison d’être for cross-national and cross-cultural survey research. Fitness for intended use cannot be met without quality on these dimensions.
- Relevance may be harder to achieve in comparative research, in that decisions have to be made about what level of relevance to aim for with a standardized survey across many cultures and countries.
- Accuracy in terms of TSE may be difficult to estimate consistently across 3MC surveys.
- Timeliness and punctuality may be a challenge in 3MC research; for example, data collection may occur in vastly different climates or with varying organizational infrastructures (see Data Collection: General Considerations).
- Accessibility in the 3MC context can mean more than simply making survey data publicly available, particularly in countries with fewer resources, where it may also be necessary to include capacity building or data user training to make the data truly accessible to local users. Country-level data access laws and regulations can also come into play (see Data Dissemination).
- Interpretability.
Figure 3: Survey process quality management.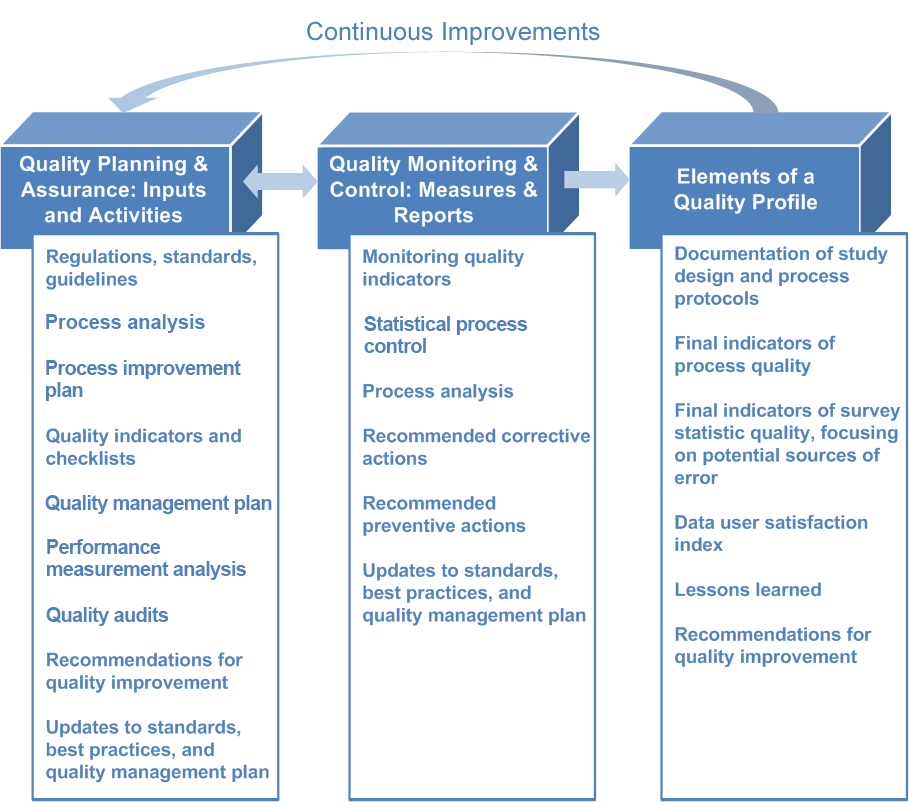
1.1 Clearly document the role and tasks of the coordinating center and the responsibilities of each country’s coordinator in the quality management plan (see Guideline 2).
1.1.1 The tasks of the coordinating center include [zotpressInText item="{2265844:DUHNMIAC}"]:
-
-
- Study design.
- Coordination with national bodies, as necessary.
- Development of specifications for processes and participating survey organizations.
- Providing instructions and support to each participating country.
- Implementing and supervising survey operations.
- Maintaining adherence to user demands and study design.
- Design of quality control procedures.
- Suggestions for future improvements.
- Documentation of survey process and results.
-
1.1.2 The responsibilities of the country or local coordinator include:
-
-
- Organizing scheduling.
- Communication with the coordinating center.
- Deliverables to and from the coordinating center, such as questionnaire designs (see Questionnaire Design).
-
1.2 Set up the supporting system for the coordinating center. For example, the Central Coordinating Team (CCT) of the European Social Survey (ESS) is supported by a Scientific Advisory Board, as well as four Specialist Advisory Groups on question module design, methods, sampling, and translation [zotpressInText item="{2265844:DUHNMIAC}"].
1.3 Set up rules and routines for coordination, such as who the country coordinators should be (e.g., subject matter expert or survey manager), when to communicate and by what method(s) (e.g., email, telephone, video conference calls), and the contents of the deliverables.
1.3.1 If possible, appoint an experienced survey manager, instead of a subject matter specialist with minimal survey experience, as a coordinator. As mentioned by [zotpressInText item="{2265844:DUHNMIAC}" format="%a% (%d%)"], it is important that the coordinator be familiar with error structures associated with different survey operations and appreciate the need for quality assurance and quality control.
Lessons learned1.1 To pursue optimal comparability, the European Social Survey (ESS) has set up an infrastructure with a Central Coordinating Team (CCT) at the center. This team receives feedback from national coordinators (NCs) in participating countries and closely monitors adherence to survey instruction and requirements [zotpressInText item="{2265844:DUHNMIAC}"]. At the design stages and during fieldwork, when there is need for ESS input, final decisions and specifications are made by the CTT [zotpressInText item="{2265844:K8PJV7RT}"]. Figure 4 shows the organizational structure of the ESS.
Figure 4: Organizational structure of the ESS.
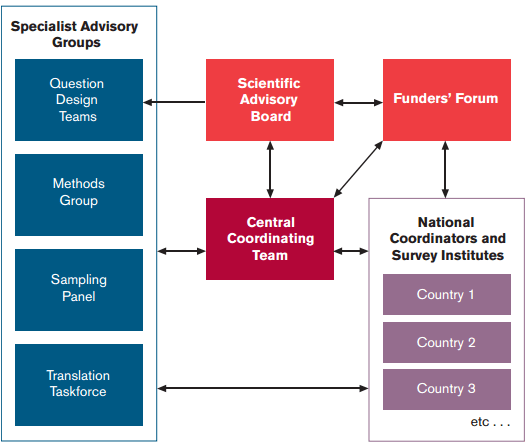
Source: ESS information brochure.
1.2 Few organizations have evaluated the infrastructure model they use. [zotpressInText item="{2265844:DUHNMIAC}" format="%a% (%d%)"] suggests that, given that many 3MC surveys still have very weak infrastructures for coordination and monitoring, evaluation studies on current infrastructures could eventually result in more efficient infrastructure formations.
2. Develop a sustainable quality management plan. Rationale A sustainable quality management plan is essential for developing planned, systematic quality assurance (Guideline 3) and quality control (Guideline 4) activities, which in turn helps ensure that the study and survey data meet client and user requirements. It also facilitates the development of a quality profile (Guideline 5), which should document survey methodology, key indicators of quality, lessons learned, and recommendations for improvement. Procedural steps2.1 Review available 3MC survey standards and best practices for ensuring the quality of survey processes, survey data, and documentation (such as these guidelines).
2.2 Review existing quality profiles (see Guideline 5) and lessons learned from other studies. Use standardized quality profiles and protocols to establish sustainable quality management.
2.3 Review study requirements for quality assurance (see Guideline 3) and quality control (see Guideline 4). These may be developed at the study design stage by the coordinating center, the survey organization, or both.
2.4 Review study goals and objectives, required products and deliverables, and study timeline and budget.
2.5 Review country-specific regulations and legislation relevant to conducting survey research.
2.6 Through analysis of the processes in the survey lifecycle—i.e., process analysis—identify characteristics of survey products (e.g., coded data) that could vary during the processes (e.g., verification failures) [zotpressInText item="{2265844:KW4B3BHI}"]. For example:
2.6.1 Use tools to analyze a process to determine what steps in the process need to be monitored to ensure quality and to identify quality indicators to monitor [zotpressInText item="{2265844:KW4B3BHI}" etal="yes"]. Examples of tools used to analyze processes are:
-
-
- Cause-and-effect diagrams ('fishbone' diagrams).
- Flowcharts.
-
2.7 Identify key indicators of the quality of the product(s) of the process in terms of TSE and other dimensions of quality, as well as factors such as cost, burden, and the risk of not meeting quality requirements. See Appendix A for examples of survey quality indicators as they relate to the TSE and fitness-for-use quality dimensions. Note that many of the indicators are constructed using paradata and other auxiliary data such as survey time and keystroke data; see Paradata and Other Auxiliary Data for more information.
2.7.1 If possible, use such indicators to determine whether the process is stable or controlled; that is, whether variation on a key indicator is due to randomness alone. This can be done using paradata from similar studies the organization has conducted or is conducting, or from pilot studies.
2.7.2 Define measurement and reporting requirements for use during quality assurance (see Guideline 3) and quality control (see Guideline 4), and determine who would be responsible for ensuring that quality assurance and quality control activities are carried out.
2.7.3 Assess whether these requirements can be met through current procedures and systems and with currently collected paradata; and if not, develop a process improvement plan.
2.7.4 Create cost/error tradeoff decision rules about how to alter the features of the study design if the goals are not met. For example, consider using responsive design, wherein researchers continually monitor selected paradata to inform the cost/error tradeoff in real time, as the basis for altering design features during the course of data collection or for subsequent waves (see Paradata and Other Auxiliary Data).
2.8 Use quality planning tools (see Appendix B) to help determine what performance analyses and assessments should be used. Such tools include:
2.8.1 A cost-benefit analysis of potential quality management procedures and activities: evaluating their benefits in relation to the cost of performing them relative to overall study costs.
2.8.2 Benchmarking: comparing planned activities and their outcomes against those of similar studies to form a basis for performance measurement.
2.8.3 Statistical analysis of factors that may influence indicators of process or product quality.
2.9 Develop a quality assurance plan, which could include (see Appendix B):
2.9.1 The process improvement plan.
2.9.2 Performance and product quality baselines.
2.9.3 Process checklists.
2.9.4 A training plan.
2.9.5 Recommended performance analyses and assessments (e.g., quality assurance procedures for verifying interviews and evaluating interviewer performance).
2.9.6 Required process quality audits, reviews, and inspections (e.g., a review of tapes of interviews to assess interviewer performance).
2.10 Develop a quality control plan for continuous monitoring of processes to ensure that they are stable and that products are meeting requirements (see [zotpressInText item="{2265844:KW4B3BHI}" format="%a% (%d%)" etal="yes"], Guideline 4, and Appendix B). Such a plan could include:
2.10.1 The process improvement plan.
2.10.2 Performance and product quality baselines.
2.10.3 Quality indicators identified in process analysis and planning for responsive design.
2.10.4 Performance analyses and assessments to use for monitoring processes.
2.10.5 Tools to use for monitoring processes and product quality (e.g., Pareto charts and statistical process control charts).
2.10.6 Reports to prepare on performance measurement, such as interviewer training certification. Interviewer behavior can be monitored and evaluated using paradata and other auxiliary data. See the Paradata and other Auxiliary Data chapter for more information.
2.11 Develop procedures to ensure that throughout the survey lifecycle all documentation, reports, and files related to quality planning and assurance, quality monitoring and control, and process improvement are retained. This facilitates preparing a quality profile for users of the disseminated survey data (see Guideline 5 and Data Dissemination).
2.12 Develop procedures for updating the quality management plan as needed during the survey lifecycle.
Lessons learned2.1 There are many quality management methodologies that survey organizations may use that focus on the three levels of quality: product, process, and organization; for example, total quality management (TQM). Discussion of such methodologies is beyond the scope of this chapter, but experience has shown that they can help organizations manage for quality.
2.2 Developing a quality management plan alone does not necessarily guarantee quality. Other project management practices may also affect quality. Many survey organizations and statistical agencies have recognized the value of also adhering to professional project management guidelines, such as those of the [zotpressInText item="{2265844:AG24EJQB}" format="%a% (%d%)"] and the International Project Management Association (IPMA). Many have certified project managers and follow professional project management best practices that may affect quality, schedule, and costs, such as developing risk management and communication plans. As with a quality management plan, these can be critical to ensuring the quality of processes and survey data. See Study Management for further discussion of the study management process.
3. Perform quality assurance activities. Rationale Quality assurance is defined by the planned procedures and activities (see Guideline 2) that an organization uses to ensure that the study meets process and product quality requirements; it specifies ways in which quality can be measured. Procedural steps3.1 For each stage in the survey lifecycle, perform quality assurance activities as outlined in the quality management plan. Appendix B includes quality assurance inputs and activities at each stage of the survey lifecycle. Some examples include:
3.1.1 Certification by the coordinating center that an organization’s study design and quality standards meet study standards (see Study Design and Organizational Structure).
3.1.2 Pretest consent protocols and forms to ensure comprehension (see Ethical Considerations).
3.2 Perform performance and product quality assessments. Examples include:
3.2.1 Certification of interviewers after training (rate of certification, including after followup training); that is, based on evaluation of interviews (taped or monitored), determination that the interviewer is ready to work on the study. See Interviewer Recruitment, Selection, and Training for further discussion.
3.2.2 Verification of coded questionnaires (rate of verification failures).
3.3 Generate indicators of quality for each assessment, based on baselines established in quality planning (Guideline 2), and create reports on performance and quality assessments which can be used for both quality monitoring and control (see Guideline 4) and documentation in a quality profile (see Guideline 5).
3.4 Perform quality audits at key points in the survey lifecycle. These are generally structured independent reviews to determine whether activities comply with study and organizational policies and procedures for managing quality. They are intended to identify inefficiencies in processes and to make recommendations for reducing the cost of quality management and increasing the quality of processes and products. In 3MC surveys, these generally would be done by each individual survey organization or an independent local auditor.
3.5 Provide documentation for the following aspects of quality assurance:
3.5.1 Performance and quality assessments.
3.5.2 Recommended corrective actions and corrective actions taken.
3.5.3 Updates to baselines.
3.5.4 Changes to the quality assurance plan.
4. Perform quality control activities. Rationale To ensure that standards and requirements are met, it is necessary to monitor study processes and the products produced against predetermined baselines and requirements and to continuously evaluate whether processes are stable and quality requirements are being met [zotpressInText item="{2265844:M8ZJBZXV},{2265844:DUHNMIAC}"]. This may lead to recommendations for preventing or minimizing error or inefficiencies, updates to the quality management plan (see Guideline 2), and suggestions for improving standards and best practices. The result is a continuous process through improved quality assurance (see Guideline 3) and quality monitoring and control improvement [zotpressInText item="{2265844:M8ZJBZXV},{2265844:DUHNMIAC},{2265844:8XNZHEFA}"]. As indicated in Figure 3, quality control is closely linked to quality assurance, and the outputs of each feed into the other. Procedural steps4.1 Perform quality monitoring and control activities as outlined in the quality management plan, such as (see Appendix A for examples):
4.1.1 Monitor process quality indicators (see Guideline 2).
4.1.2 Analyze and report on results of quality assurance activities, such as interviewer training certification, data entry verification, checking that a process met specifications, etc.
4.1.3 In accordance with the quality management plan (see Guideline 2), generate charts and graphs to monitor processes. Examples of such tools [zotpressInText item="{2265844:KW4B3BHI}"] are:
-
-
- Pareto chart.
- Statistical process control chart.
-
4.2 Perform process analysis if quality requirements are not being met (see Guideline 2). For example, the European Social Survey (ESS) closely monitors the survey process and collects paradata and other types of auxiliary data using contact forms.
4.3 Determine whether there is a need to:
4.3.1 Recommend corrective actions.
4.3.2 Modify the process improvement plan.
4.3.3 Modify the quality management plan.
4.4 Provide documentation for the following aspects of quality control:
4.4.1 Performance and quality assessments.
4.4.2 Recommended corrective actions and corrective actions taken.
4.4.3 Updates to baselines.
4.4.4 Changes to the quality management and quality assurance plans.
Lessons learned4.1 Some organizations have used quality control techniques to monitor survey data collection processes and adapt study designs when quality goals are not met. This is known as 'adaptive' or 'responsive' survey design [zotpressInText item="{2265844:IE24SDS2}"]. For example, the National Survey of Family Growth (NSFG) uses paradata collected by interviewers to make judgments about the likelihood that individual sample cases will become respondents. By building predictive response propensity models using paradata, it is possible to estimate the probability that the next call on a sample case will produce an interview. Such information is used in a responsive design framework to reduce nonresponse in NSFG [zotpressInText item="{2265844:IE24SDS2}"]. See also Data Collection: General Considerations for further discussion on responsive design.
4.2 The European Social Survey (ESS) has developed a solid and continuously improving machinery for planning and implementing the survey [zotpressInText item="{2265844:BWMUUHCE}"]. It closely monitors the survey process, collects various types of paradata and other auxiliary data using contact forms [zotpressInText item="{2265844:K8PJV7RT}"], and documents the paradata for each wave of the survey. As mentioned by [zotpressInText item="{2265844:BWMUUHCE}" format="%a% (%d%)" etal="yes"], recent discussions on quality control of the ESS have concerned the issue of more timely interventions when countries have implementation problems.
5. Create a quality profile. Rationale A quality profile (also known as a quality report) synthesizes information from other sources, documenting survey methodology used throughout the survey lifecycle and providing indicators of process and data quality (sampling and nonsampling errors), corrective actions taken, lessons learned, and recommendations for improvement and further research. It provides the user with all information available to help assess data quality in terms of fitness for intended use, total survey error, and other factors discussed in this set of guidelines. See [zotpressInText item="{2265844:IRZVGYKZ}" format="%a% (%d%)"] for an example of guidelines for such reports, [zotpressInText item="{2265844:NPV4W9H3},{2265844:FXB89GFX}" format="%a% (%d%)"], and the [zotpressInText item="{2265844:G3JB5KF5}" format="%a% (%d%)"] for examples of quality profiles, and Appendix A for examples from other sections of these guidelines. Procedural steps5.1 Document procedures and methodology used for key stages or processes in the lifecycle (see Appendix B). For example, for sample design this would include:
5.1.1 Time dimension of design (e.g., one-time cross-sectional, fixed or rotating panel).
5.1.2 Target and survey population definitions, including inclusion/exclusion criteria.
5.1.3 Sampling frame(s) descriptions.
5.1.4 Maps and protocol used in field listing.
5.1.5 Description of all stages of selection, including sample sizes, stratification, clustering, oversampling, and number of replicates fielded at each stage.
5.1.6 Documentation of procedures to determine probabilities of selection and weights for each stage of selection.
5.1.7 Tables of the precision of the estimates of key survey statistics.
5.1.8 (If necessary) descriptions of substitution procedures.
For each process documented, this should include:
5.1.9 Quality assurance procedures.
5.1.10 Quality control procedures.
5.1.11 Corrective actions taken.
5.2 Provide key indicators of quality for all dimensions of quality (see [zotpressInText item="{2265844:IRZVGYKZ}" format="%a% (%d%)"] and Appendix A), some of which can be collected during data collections, others afterwards. They include:
5.2.1 Comparability.
5.2.2 Coherence.
5.2.3 Relevance.
5.2.4 Accuracy (see Quality Framework), including:
-
-
- Measurement error.
- Processing error.
- Coverage error.
- Sampling error.
- Nonresponse error.
- Adjustment error.
-
5.2.5 Timeliness and punctuality.
5.2.6 Accessibility.
5.2.7 Interpretability.
5.3 Document lessons learned and make recommendations for improvement in studies of the same design, and if possible, make recommendations for methodological research that could inform the design of similar studies in the future. Such information would be useful for the study’s coordinating center and national survey agencies, as well as for researchers and organizations interested in conducting similar studies.
Lessons learned5.1 The ESS provides a well-documented quality report, which includes fieldwork procedures, fieldwork results, and analysis of different error sources.
5.2 In 3MC surveys, a quality profile is often created for each study location. For example, the Survey of Health, Ageing and Retirement in Europe (SHARE) Compliance Profiles documented a set of quality control indicators on which each country is evaluated [zotpressInText item="{2265844:R3YD9SA3}"]. [zotpressInText item="{2265844:ESSRTE6L}" format="%a% (%d%)"] discuss pilot testing the SHARE Quality Profile.
References [zotpressInTextBib style="apa" sortby="author"]